

ProductElevation and hillshade
Elevation and hillshade maps for your fields
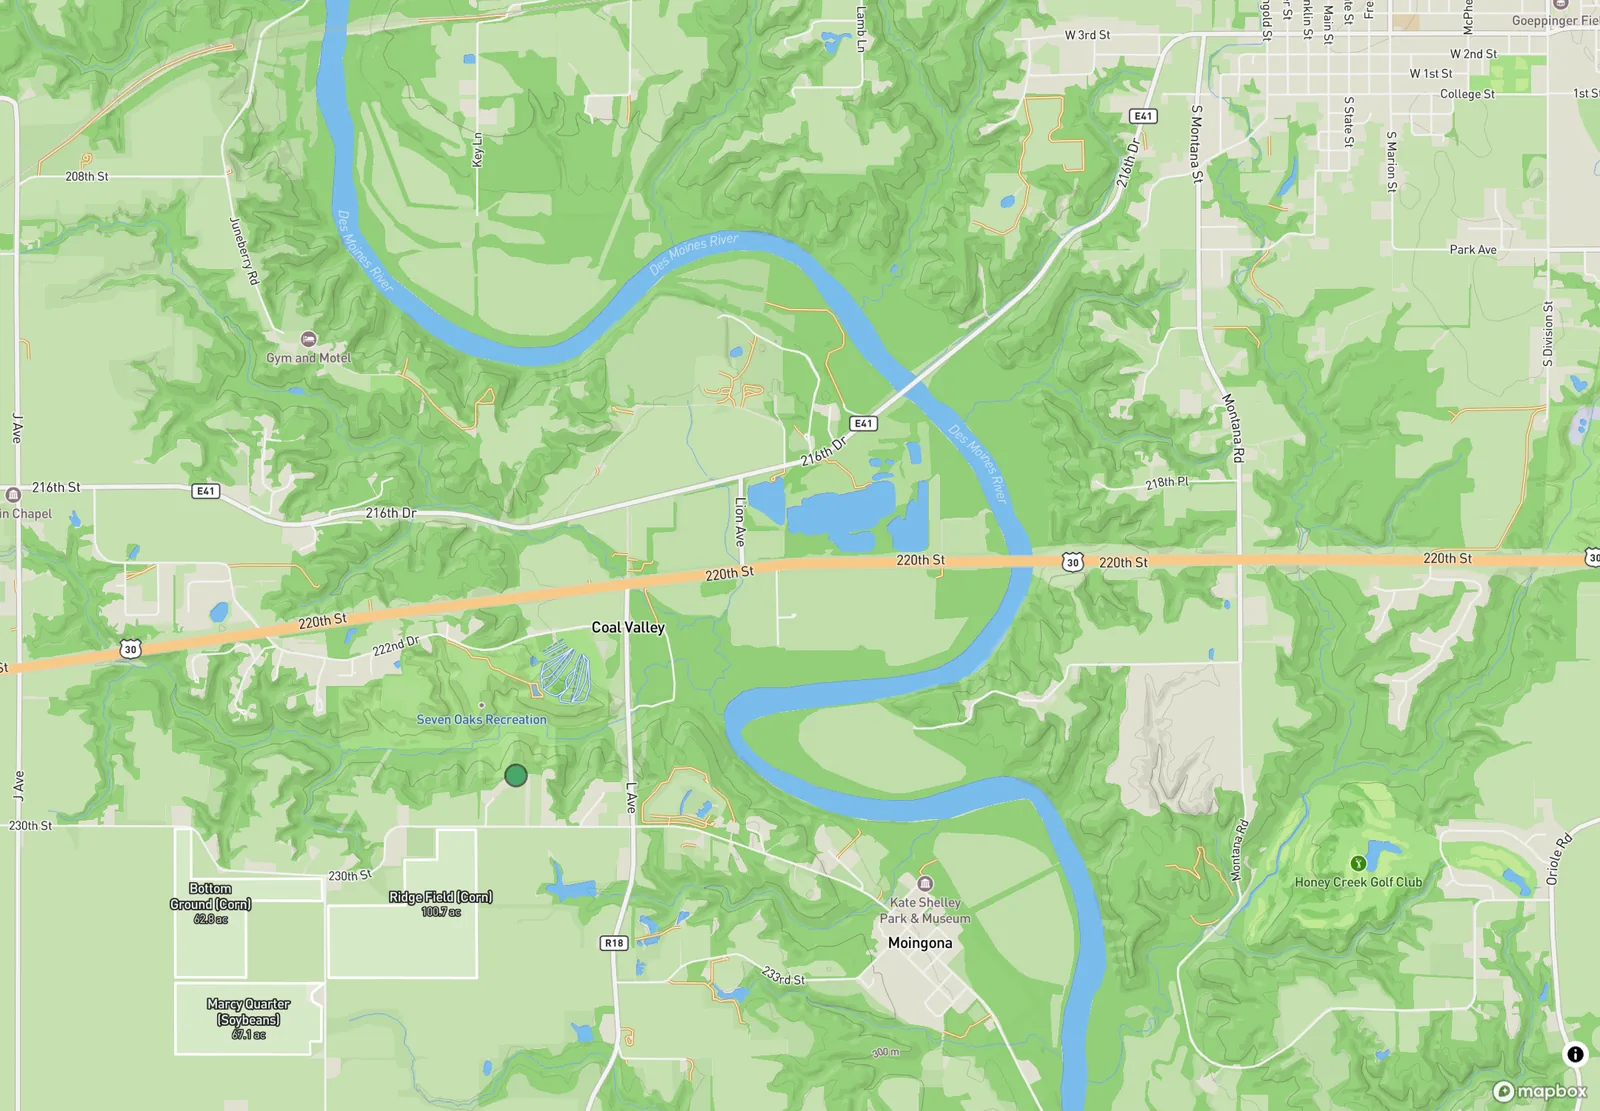
PropelMapper shades the relief of every field with hillshade and contour lines, so the low corner and the draw that feeds it are obvious before you walk out to them.

Reading slope before the field walk
Most of the field problems that bring an advisor out in June have water somewhere in the story. Ponding by the tile outlet. Yellow corn in the low end. A washout across the waterway. On satellite imagery all of it sits on what looks like a flat green rectangle.
Turn on Elevation in the map's layers and the rectangle gets a shape. Hillshade lights the slopes as if the sun were low, and contour lines mark the steps between them. A draw running across a field shows up, and so does the reason its low end holds water after every storm.
We think terrain explains a lot of what an advisor sees in a field, because terrain decides where water goes and water decides so much of the rest. It belongs on the same map as the visit pins, not in a separate survey file nobody opens.
Annual monitoring: what you said and what the report says
An easement monitor walking a parcel for the first time, with elevation on.
“North parcel. The draw on the elevation map lines up with the wet strip along the fence. No new disturbance inside the easement, the old ditch is still grassed over.”
Annual monitoring - North parcel
At a glance
A wet strip along the north fence follows the natural draw shown on the elevation map. No new disturbance found inside the easement area, and the historic ditch remains grassed.
Observations
A wet strip along the north fence follows the natural draw shown on the elevation map. No new disturbance found inside the easement area, and the historic ditch remains grassed.
After your review
Example account: Prairie Agronomy
Contour lines every 10 meters
The Elevation layer draws a contour line every 10 meters of rise, with every fifth line heavier and labeled. A US team reads those labels in feet. Where the lines bunch together the ground is steep, and where they spread apart it is close to flat. That is usually enough to show a landowner why the back forty floods, or a lender why one parcel drains worse than its neighbor.
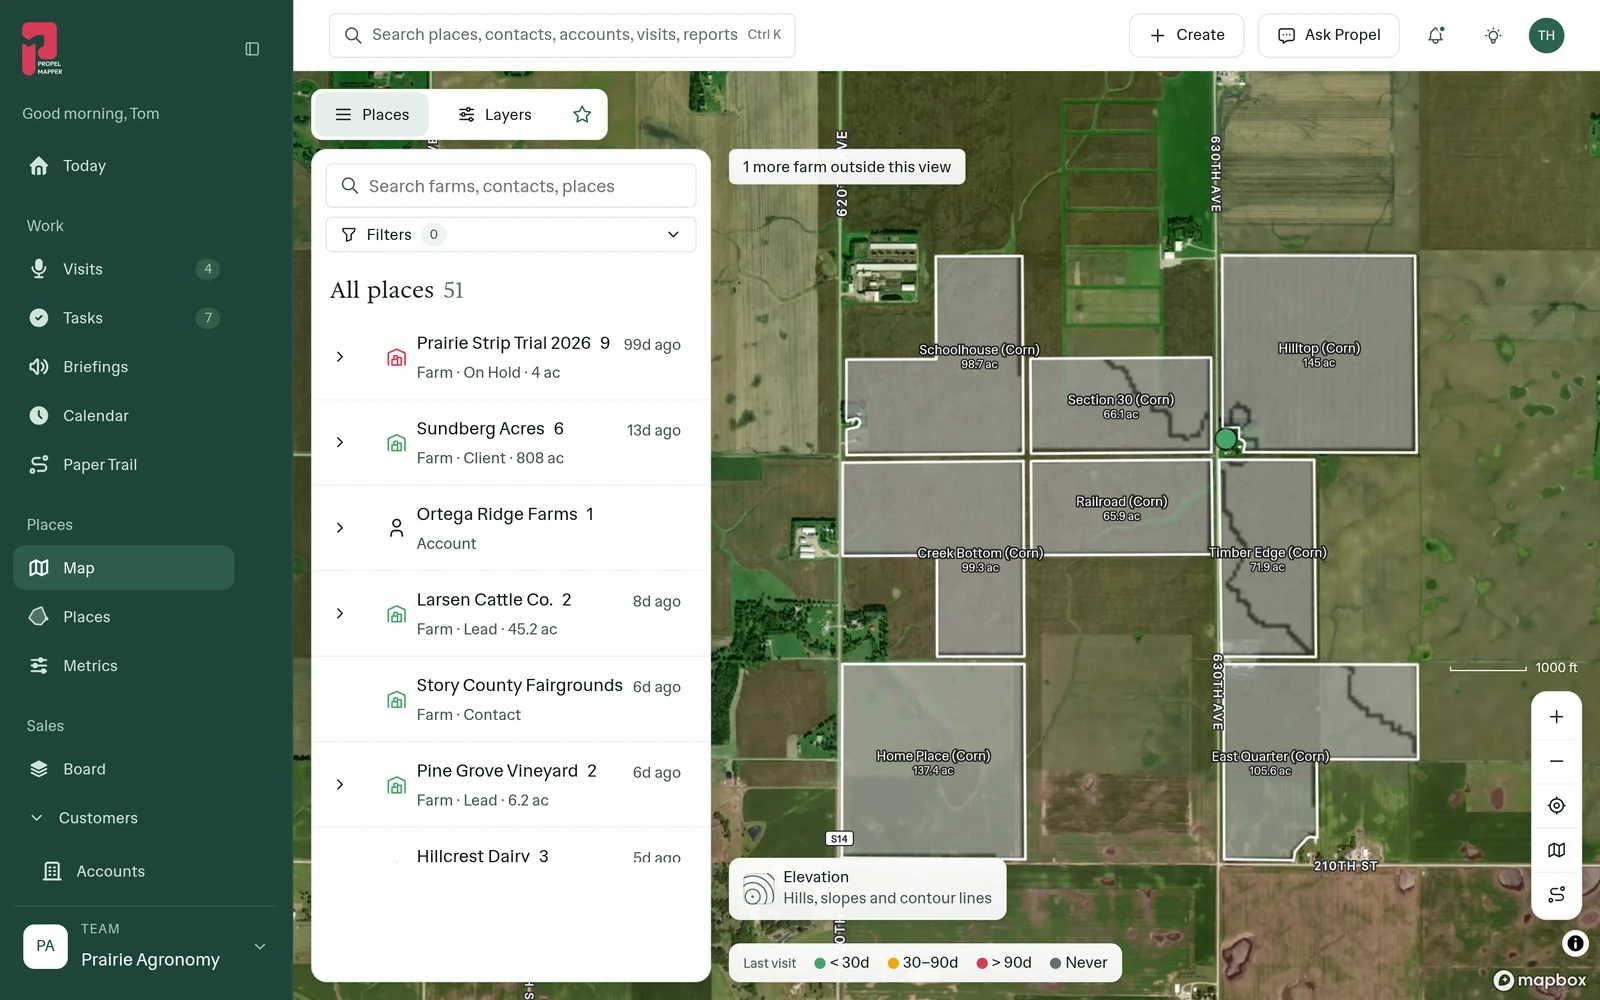
On the phone, turn on Elevation under Map layers. Standing in the field, the hillshade shows which direction is downhill before you pick where to dig a pit or take a sample.
Elevation under boundaries and pins
Elevation is a layer like soil or crop history, so it sits under everything else: the boundaries, the last-visit colors, the pins from today's walk. A pin by the outlet on a hillshade map explains itself. A photo of standing water at the bottom of a contour line does not need a paragraph.
Switch the base map to Terrain and trails when you also need roads, tracks and field entrances, which is usually the case for the first visit to a farm you do not know.
What the relief does not show
Elevation shows the general shape of the ground: slopes, draws, low ends. It does not show tile lines, culverts, a plugged outlet or the berm someone pushed up last fall. It is a starting point for the walk, not a substitute for it, and not a survey for anyone designing drainage.
Use it to decide where to look first and to explain what you found. The pin in the low corner and the photo of standing water are still the evidence. The hillshade is why they make sense together.
In the app
Example account: Prairie Agronomy
Questions about elevation and hillshade
Where does the elevation data come from?
The hillshade and contours are drawn from Mapbox's elevation model. They show the general shape of the land. They are not a survey and should not replace one for drainage design.
Does elevation work on the phone?
Yes. Turn on Elevation under Map layers in the phone app.
Who it’s for
Drainage and irrigation contractors, conservation planners, easement monitors, farmland appraisers and farm managers who need to see the shape of the ground, not just its color.